Copyright © 2026 MOMENTUMMEDIA
As a marketer, you invest time and money into digital advertising because you know it will drive traffic. But how do you know which channel is performing the best? If you know what message delivers the best ROI for your business you can tailor future messages to capitalise on this insight.
One of the easiest pieces of technology used to track your campaigns is also free to use and implement on your site!
What is Google Analytics?
Google Analytics is a tool that allows you to see all the traffic that lands on your site, and what they do when they get there. Simply speaking, the site administrator loads unique tags to your website that appear within the code of each page. These tags track behaviours of the user while they are on your site as well as information about how they got to your site.
What are UTM parameters?
UTM parameters are pieces of code that are applied to a URL that tells Google Analytics tags a little bit about where the user came from when they landed on the page. Here is an example of a URL with UTM parameters applied to them:
https://www.theadviser.com.au/?utm_source=smsfadviser.com&utm_medium=display&utm_content=MREC&utm_campaign=launch&utm_term=save-the-date
There are 5 variants that you can track within one UTM string of the URL - source, medium, campaign, term, and content.. Let’s looks at the same URL above but broken down into its parts:
https://www.theadviser.com.au/ - this is the original, unaltered URL
? - the question mark denotes the end of the URL and the start of the UTM parameters
utm_source=smsfadviser.com - ‘source’ is typically used to describe where the traffic came from
& - the ampersand symbol denotes the end of one parameter and the start of the next
utm_medium=display - ‘medium’ typically tracks what type of content the user was on when they landed on your site
& - the ampersand symbol denotes the end of one parameter and the start of the next
utm_content=MREC - we typically use ‘content’ to separate and identify specific ad units for a campaign
& - the ampersand symbol denotes the end of one parameter and the start of the next
utm_campaign=launch - ‘campaign’ will allow you to track certain campaigns or parts of a campaign
& - the ampersand symbol denotes the end of one parameter and the start of the next
utm_term=save-the-date - the ‘term’ variant is mainly used with paid search advertising, but you can still utilize it to drill down further on a campaign
https://www.theadviser.com.au/?utm_source=smsfadviser.com&utm_medium=display&utm_content=MREC&utm_campaign=launch&utm_term=save-the-date
Using five variants we can tell Google Analytics additional information about how the user arrived to your site.
How does UTM tagged traffic appear in Google Analytics?
You can see all the UTM tagged traffic to your site from within Google Analytics in a few different ways. Below is how you would see traffic to your site overall (ie not specific to a certain landing page):
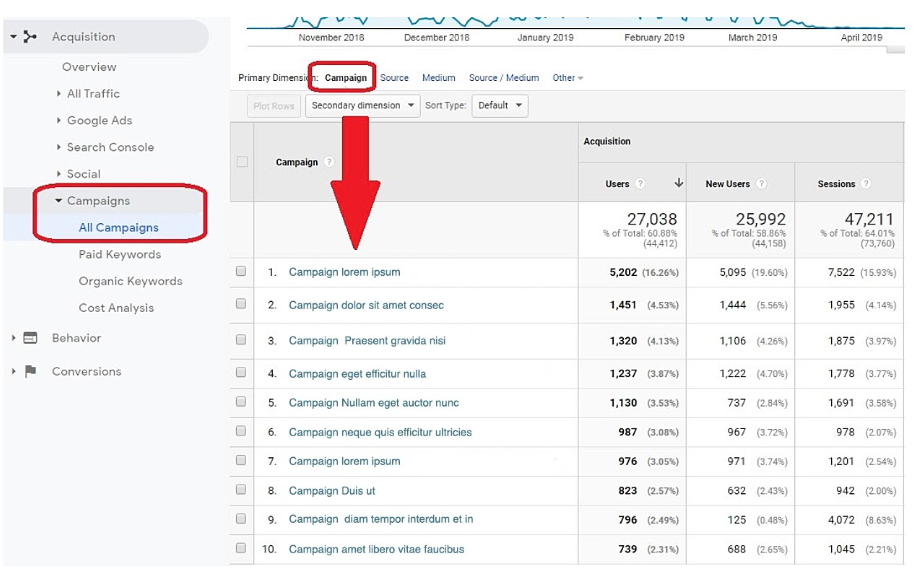
Notice the additional variants listed next to ‘primary dimension’, this is how you can see the other variants in the first column. You can add a ‘secondary dimension’ by clicking the drop down, this will allow you to have two variants in the one table. However, the best way to drill down on the traffic is by clicking on one of the values in the variant and following them down from there.
What is Data Studio?
Data Studio is a Google product that enables the visualisation of data from various sources. For example it can visualise data from several Google Sheets. The sources are not just limited to Google’s product though , with other third party data sources being available to plugin.
here’s an example of how to visualise Google Analytics Data. First you’ll want to create a new blank page and connect a data source, in this example the data source is ‘Google Analytics’:
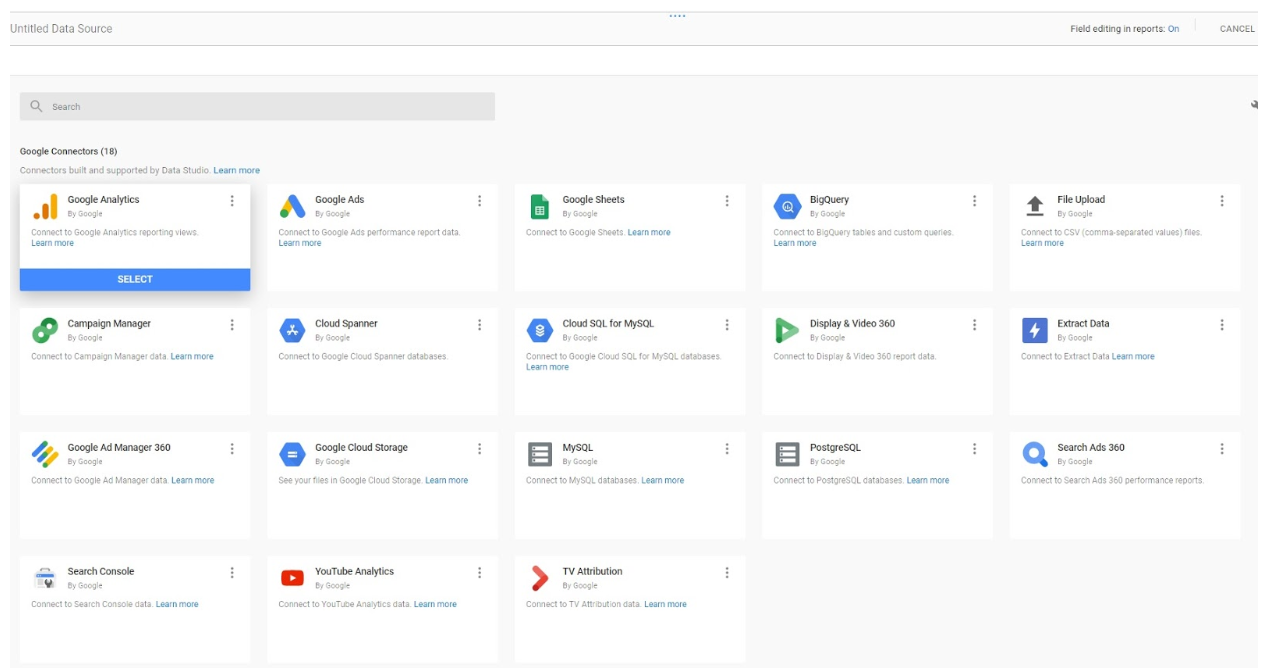
Next choose your account or title name from the list and follow the steps to complete the setup.

Add the table to your page and then click on the table to adjust the dimensions and metrics you want to track together. For instance to track 4 of the 5 variants - source, medium, content, and campaign. We also set the metrics to see on each dimension/variant, here we have included ‘pageviews’ and a goal that we set up ‘completed registration’:
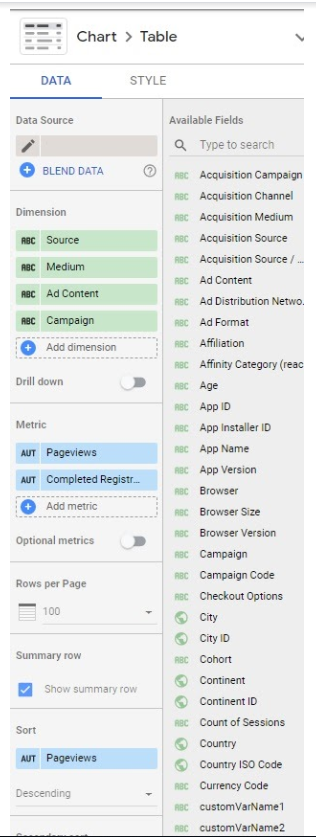
As each element is added the table will automatically update and you should end up with all the data visualised in a table. lick on columns to order them by a specific metric or variant. In the top panel shown in the second to last image you can also add in a calendar or date range element so that you can see the traffic results for a specific period of time.
There is an abundance of other possibilities and techniques you can use within Data Studio, we highly recommend reading through forums or Google searching other possibilities, but this is a great place to start.
Summary
Digital advertising is a great way to get your brand and product in front of the right audience, but without data and insights it will be difficult to identify performance. u. By combining UTM parameters, Google Analytics, and Data Studio you can really identify which channel and message resonates best with your audience and visualise this data in a way that delivers immediate and informed decisions on your marketing plan.